




Christopher Ahlberg & Erik Wistrand
Department of Computer Science and SSKKII
Chalmers University of Technology
S-412 96 G�teborg
Phone: +46 31 772 5410
Email: {ahlberg,wistrand}@cs.chalmers.se
Today, a form fill-in module is provided with most commercial database management systems (DBMS).
The form fill-in module allows users to easily create forms for both entering data into and querying a
database. Similar to a form fill-in module, a dynamic queries system could be provided with a DBMS. The
dynamic queries system could allow the automatic creation of a visual query system from a database
relation.
Users are initially prompted to specify which attributes should be used for creating visualizations. IVEE
currently offers the following visualizations:
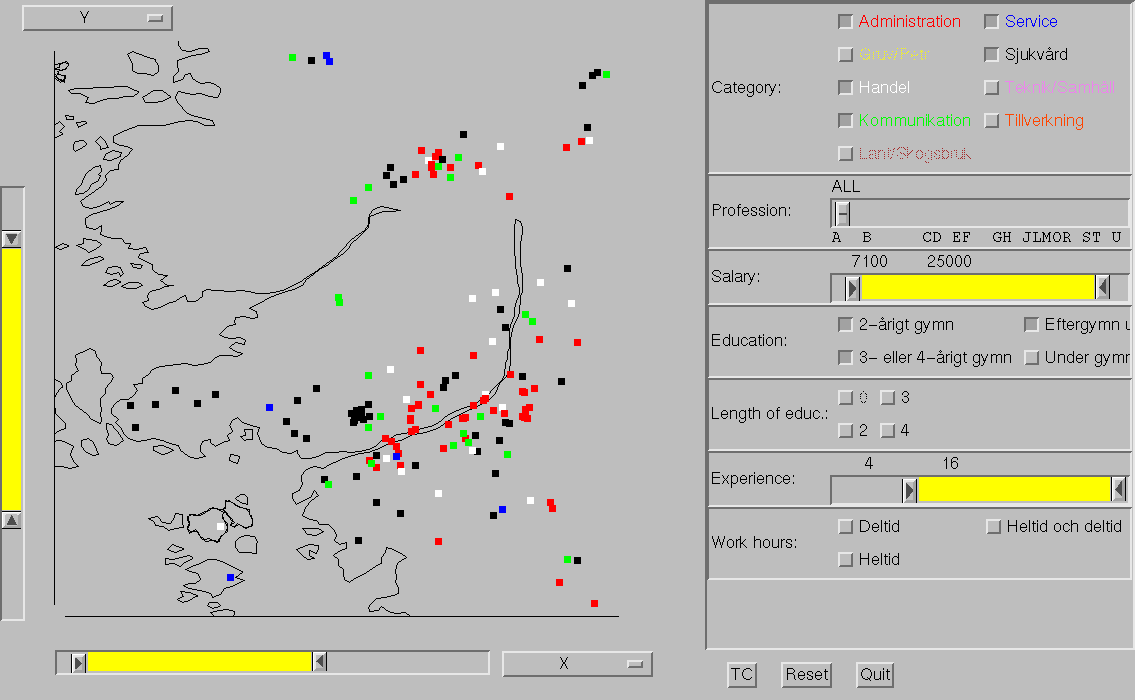
Figure 1:Dynamic queries system created with IVEE - an interface to a
job/skill matching database.
For geographic maps and scatterplots, users are prompted to specify two attributes - one for each of the X
and Y axes. This highlights one limitation of IVEE - the need for attributes suitable for visualizations. For
the cluster visualization, users specify which attributes the items in the database should be clustered from.
To create geographic visualizations, users specify two attributes holding geographic coordinates for a
visualization. By also providing a file holding vectors defining a background map a realistic geographic
visualization and query system can be created. As the maps are given on a vector format, arbitrary zooming
can be performed easily. See [Figure 1] for an example of a geographic visualization with a vectorized map
that has been zoomed.
After these initial specifications, users can start exploring their database. Queries are composed from the
conjunction of all the query components defined by the widgets. Manipulating a widget immediately affects
the visualization, but also the other widgets - the query mechanism is tightly coupled. A widget
manipulation restricts the query range of the other query widgets to only include criteria not leading to an
empty query result.
IVEE allows multiple visualizations to be created simultaneously, and when the query widgets are
manipulated all the visualizations are updated interactively - allowing for powerful exploration of data.
Example applications built with IVEE include: recreations of the dynamic periodic table [1], the
Homefinder [6], and the Filmfinder [2], a system for exploring linguistic data, an environmental data
explorer, etc. IVEE is implemented on top of the X11/Motif environment using C++. The systems main
components are a database, a visualization manager and a query manager.
Abstract
The Information Visualization & Exploration Environment (IVEE) is a system for automatic creation of
dynamic queries applications. IVEE can take a database relation and create an environment holding
visualizations and query widgets. IVEE offers multiple visualizations such as maps, scatterplots, and cluster
visualizations, and multiple query widgets, such as sliders, alphasliders, and toggles.
Keywords:
Information visualization, information exploration, dynamic queries, database query, tight coupling
Introduction
Dynamic queries is a concept for information exploration and database querying. The power of dynamic
queries, compared to traditional query methods, has been confirmed in controlled experiments [1][6]. A
number of interesting prototype applications has been built for experimental purposes, such as a dynamic
periodic table [1], a homefinder[6], and filmfinder [2]. The prototypes has all been constructed from scratch
in various environments, such as X11/OpenWindows or the Galaxy platform independent development
environment.
IVEE
The Information Visualization & Exploration Environment (IVEE) is an attempt at such a system.
(Footnote 1) IVEE imports a relation with
named attributes, given on a straight forward text format. The data in the relation is examined and classified
into datatypes (integers, reals, and strings) and size (number of different values held in the attribute). Based
on this examination, IVEE selects widgets for each attribute. Existing widgets are: rangesliders, alphasliders
[3], and toggles. For example, for a string attribute with more than 10 distinct items, an alphaslider is
selected, otherwise a group of toggles with a toggle for each distinct item is selected (of course the
threshold 10 can be changed). Note that, interactively while running IVEE, users can change the widget
used for an attribute, by selecting from a menu attached to the query widget currently used for the attribute.
See the right area of [Figure 1] for examples of widgets used in IVEE.
COMPARISON TO SIMILAR SYSTEMS
Similar systems to IVEE exist. Examples are XGobi [5] and the AT&T; Data Visualization Sliders [4].
These systems focus on statistical analysis which definitely also is an important area for IVEE. However,
the focus for IVEE is on database querying, which shows in the general design, but also in the widgets for
querying - such as the alphasliders and toggles.
FUTURE WORK & CONCLUSIONS
We plan to continue to develop IVEE, and extend its functionality with for example:
Although IVEE allows for powerful exploration of complex data sets, a goal has been to keep it simple.
Any user should be able to load a database and create a simple visualization together with suitable widgets
for querying.
ACKNOWLEDGEMENTS
This work was in part supported by NUTEK, grant no: 5321-93-2760, and Arbetsmilj�fonden, grant no: 94-
0525.
The authors want to thank Staffan Truv�, Jens Allwood, and Johan Hagman for fruitful discussions during
the development of IVEE.
References
[1] Ahlberg, C., Williamson, C., Shneiderman, B., Dynamic Queries for Information Exploration: An
Implementation and Evaluation. Proceedings ACM CHI'92: Human Factors in Comp. Systems (1992),
pages 619-626.
[2] Ahlberg, C., Shneiderman, B., Visual Information Seeking: Tight Coupling of Dynamic Query
Filters with Starfield Displays. Proceedings ACM CHI'94: Human Factors in Comp. Systems (1994), pages
313-317.
[3] Ahlberg, C., Shneiderman, B., The Alphaslider: A Compact and Rapid Selector. Proceedings
ACM CHI'94: Human Factors in Comp. Systems (1994), pages 365-371.
[4] Eick, S., Data Visualization Sliders, ACM UIST'94 proceedings, 1994
[5] Swayne, D. F., Cook, D., Buja, A., User's Manual for XGobi, a Dynamic Graphics Program for
Data Analysis, Bellcore Technical Memorandum, 1992.
[6] Williamson, C. and Shneiderman, B., The Dynamic HomeFinder: Evaluating dynamic queries in a
real-estate information exploration system, Proceedings ACM SIGIR Conference, pages 339-346,
1992.
FOOTNOTES:
IVEE is available on anonymous ftp from ftp.cs.chalmers.se:/pub/IVEE. See also the WWW-page
http://www.cs.chalmers.se/SSKKII/ivee.htmlReturn to text