

Shari L. Jackson
University of Michigan
1101 Beal Ave.
Ann Arbor, MI 48109, USA
E-mail: sjackson@umich.edu
The Modeler can be used to build a wide range of process
flow models; for our preliminary classroom study
we chose the domain of stream ecosystems.
The Modeler is designed using a learner-centered approach
[5], with scaffolding to address the specific needs of
learners. Scaffolding [3] is an educational term that refers
to providing support to learners while they engage in
activities that are normally out of reach. We provide
software-realized scaffolding to support learner's needs
regarding software tasks, tools, and interfaces:
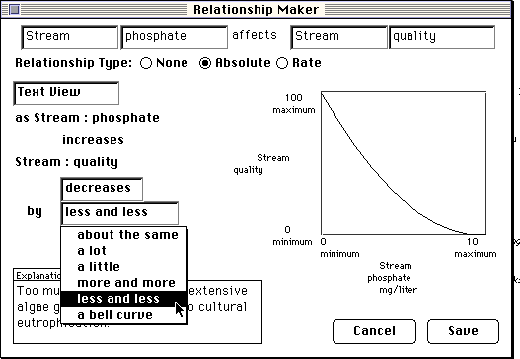
FIGURE 1
Defining absolute relationships: Text View
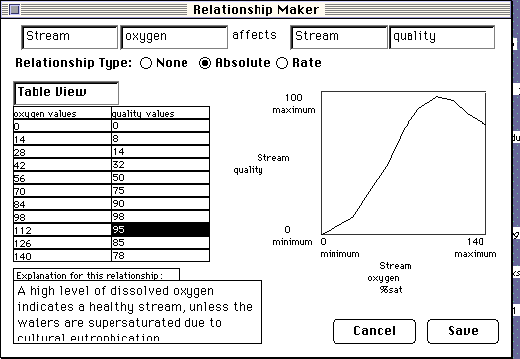
As the students' skills increase, and their needs grow more
sophisticated, they have the option of defining the
relationship more quantitatively, by entering data points
into a table (Figure 2).
FIGURE 2
Defining absolute relationships: Table View
To support different learning styles, these tools provide a
variety of ways to visualize relationships. For example,
given a qualitative definition, the software translates the
text into a quantitative representation; e.g., "decreases by
less and less" is interpreted as shown by the graph in Figure
1. This visualization of the text reinforces students'
understanding of how to "read" a graph.
The above relationships are termed "absolute," in that the
value of the affected factor is completely ("absolutely")
determined by the value of the causal factor. The Modeler
also supports the definition of rate relationships which
define feedback equations representing the rate of change
of a factor. We similarly scaffold the definition of rate
relationships by providing a qualitative representation, e.g.,
"At each time step, and for each mayfly, add mayfly rate of
growth to mayfly count."
Learners often need extra motivation to sustain interest in a
task, and the interactivity and engaging personal graphics
of the Modeler can help provide that motivation. Students
run simulations to try out experiments using their models,
such as exploring the impact of increased phosphate levels
on overall stream quality (Figure 3).
FIGURE 3
Running simulations
During a simulation, graphical meters provide real-time
feedback of changing values. The objects in a model are
displayed using photo-realistic graphics which can be
imported by students. For our classroom study, the
background graphic is a photograph of the actual stream the
students studied. By using a photo of their stream we
expect to make the task more concrete and authentic;
meaningful, personal tasks are more motivating for students
[1].
Learners also need an interface that guides them and
encourages reflection about the task. To structure the task
and guide the learner, we offer specific and useful options
(e.g., the pull-down menus in Figure 1, tabular data entry in
Figure 2), as opposed to only unrestricted text or equation
entry. To encourage reflection, we elicit articulation from
the students by providing an "explanation" field (e.g.,
Figure 2) where students can type in an explanation for
each relationship they create.
Abstract
Constructing and testing models is a complex task, but the
process helps scientists develop a better understanding of
natural systems. Similarly, we wish to support students
building models, and so we have designed the ScienceWare
Modeler with special learner-centered support for students
to do scientific modeling and simulation. With the Modeler,
students can easily construct dynamic models of scientific
phenomena, and run simulations based on their models to
verify and analyze the results. Students build their models
using an easy-to-use object-oriented visual language - not
traditional programming. This allows students to construct
models quickly and easily, focusing their attention on the
tasks of testing, analyzing, and re-examining their models,
and the understanding on which these models are based.
Keywords:
Educational applications, Science
applications, Modeling, Simulation, Multimedia, Learner-
Centered Software Design
Introduction
Scientists build models to test theories and to develop a
better understanding of complex systems [2]. We believe
that students can similarly benefit from building models.
This approach is consistent with constructionist theories of
learning [4]; in order to build an internal, mental model of
scientific phenomena, learners need to construct external
representations of the phenomena as a system.
To develop that level of understanding, students need to
engage in the activities of modeling, e.g., questioning,
predicting, constructing, verifying. Just as technology is
playing a key role in supporting professional scientists
engaged in such activities, the ScienceWare Modeler has
been designed to play a key role in supporting learners in
learning and doing modeling.
Tasks
Learners need support for learning and understanding the
task, which we designed into the Modeler by constraining
the complexity of the tasks involved in building models. To
build a model, students select from a set of high-level
objects, define the factors (measurable quantities or
characteristics associated with each object), and define the
relationships between the factors. For example, in our
example domain of stream ecosystem modeling, students
might start with the stream object, define its factors
"phosphate" and "quality," and then define the relationship
between them, all in a matter of minutes.
Tools
Learners need tools that adapt to their level of expertise, so
the Modeler provides a range of ways to define
relationships. Initially, relationships can be defined
qualitatively by selecting descriptors in a sentence, e.g.,
"As stream phosphate increases, stream quality decreases
by less and less" (Figure 1).
Interfaces
STATUS
ScienceWare is a research project in collaboration with
local science teachers to develop, pilot, and assess a three
year high school science curriculum emphasizing
modeling, project-based activities, and routine use of
computing technology. The Modeler was tested with a pilot
class of ninth graders in Spring 1993, and again in Fall
1994, with encouraging results. New versions of the
Modeler are being developed, and will be used extensively
as part of this new science curriculum in several classes this
year.
Acknowledgments
This research has been supported by a grant from the
National Science Foundation (RED 9353481) and the
University of Michigan.