



Lisa Tweedie, Bob Spence, Huw Dawkes and Hua Su
Department of Electrical and Electronic Engineering,
Imperial College of Science, Technology and Medicine
South Kensington , London, SW7 2BT
Tel: +44 171 594 6261
l.tweedie@ic.ac.uk
Abstract
This paper illustrates the benefits, for a wide range of
design activities, of Interactive Visualization Artifacts .
Introduction
In an extremely wide range of design tasks, of which
electronic product design is an example, the designer is
concerned with theinfluence of the
parameters - whose values can be
chosen - upon the performances which
are of direct interest to the customer. Interactive
visualization allows the fluent exploration of the effect of
parameters upon performances and, thereby, the acquisition
of insight, a valuable commodity in any design situation.
INFLUENCE PROBLEMS
In any design the performances of an artifact are
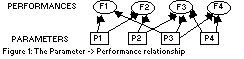
determined by a set of parameters (FIGURE 1: The
Parmeter -> Performance relationship). Requirements are
placed by a customer on the performances F1, F2....Fn (F).
It is then the task of the designer to choose values of the
individual parameters P1,P2...Pn (P) that will lead to a
design that satisfies these requirements. There may easily
be as many as 100 Ps and Fs of interest. Design is difficult,
partly because each performance is determined by many
parameters, partly because the relation between P and F is
usually non-linear, and partly because the requirements
may be difficult or impossible to satisfy. The greatest
difficulty, however, arises because, whereas, F can be
directly calculated if P is known, the reverse is not
true.
Even if a satisfactory parameter set is found, a further complication arises. Uncertainty is always present in the manufacturing process, so that each parameter is characterised, not by a single value, but by a nominal value and a tolerance range. This tolerance range defines the extent to which a parameter may randomly differ from the nominal value. Mindful that wider tolerances are usually associated with lower cost, one of the designer's tasks is to choose a tolerance range for each parameter so that, despite parameter variation within this range, as many mass- produced copies of the artifact pass the specification as possible. The fraction that pass is called the yield.
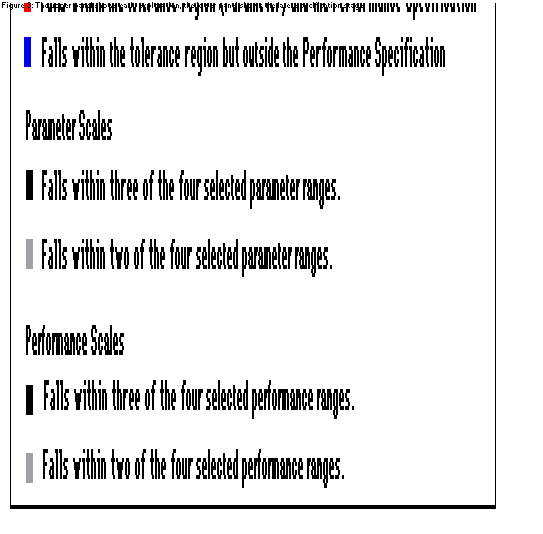
Many actions can be taken by the designer. For example in the early stages of exploration the designer may select a range on a scale. All the bulbs within that range will be highlighted on each of the other scales [2]. Another facility allows "main effects" to be judged. When a range is moved up and down a scale, a yellow circle is displayed on each of the other scales. This indicates the average of all the relevant lamps, allowing correlations and trade offs, so crucial to design, to be discovered. The selection of one square (i.e. one bulb) on one histogram highlights that same bulb on the other histograms, and numerical values can be examined. The line joining these squares (FIGURE 3: The upper panel shows early exploration and the lower panel shows the later specification stages) can be displayed, allowing a number of bulbs to be compared (parallel co- ordinate plots [3]).
The designer can set a specification on the performances and a secondary specification can then be placed on the parameters, indicating a tolerance region (as shown in the lower panel). The crosses represent those bulbs that satisfy both specifications. The squares with dots represent those bulbs which satisfy the tolerance region but not the performance specification. These same bulbs are represented on the performance histograms in black (if they fail one requirement) and grey (if they fail two). It is these bulbs that cause a lower manufacturing yield. The same colour coding is used on the parameter histograms. This gives a simple indication of why the remaining bulbs fail to meet the tolerance region specification.
When a reasonable tolerance region has been found the designer can "zoom in". This recalculates the histograms using the tolerance region as the new parameter ranges for the model. In this way a more accurate understanding of the yield can be gained.