




Henry Lieberman and Christopher Fry
Media Laboratory
Massachusetts Institute of Technology
Cambridge, Mass. USA
lieber@media.mit.edu
Harlequin, Ltd.
1 Cambridge Center
Cambridge, Mass. USA
cfry@harlequin.com
Program debugging can be an expensive, complex and frustrating process.
Conventional programming environments provide little explicit support for the
cognitive tasks of diagnosis and visualization faced by the programmer.
ZStep 94 is a program debugging environment designed to help the
programmer understand the correspondence between static program code and
dynamic program execution. Some of ZStep 94's innovations include:
Programming environments, psychology of programming,
debugging, educational applications, software visualization
FIGURE 1
Opening frame of a QuickTime video demonstrating ZStep 94 prototype.
DYNAMIC FIGURE 1 (Complete QuickTime Movie, 2.8 mb).
Donald Norman [12] refers to the Gulf of Evaluation and the Gulf of
Execution as the gaps that often occur between the user's intent, the
actual effect of a command given to the computer, and the result. In
programming, this manifests itself as the difficulty of understanding the
dynamic behavior of a program from the static source code of the program. The
primary cognitive task in debugging is forming a mental model of the
correspondence between code and behavior.
Programming is the art of constructing a static description, the program code,
of a dynamic process, the behavior which results from running the program. In
that sense, it is analogous to composing music. The program code is like a
musical score, whose purpose it is to cause the performer [in the programming
case, a computer] to perform a set of actions over a period of time.
What makes programming cognitively difficult is that the programmer must
imagine the dynamic process of execution while he or she is constructing the
static description, just as a composer must "hear the piece" in his or her
head, while composing. This puts a great burden on the programmer's short term
memory. What makes programming even more difficult than composing is that a
musical composition usually specifies a single performance, whereas a program
may be executed in a wide variety of conditions, with different resulting behavior.
Many, if not most, routine program bugs result from a discrepancy between the
programmer's imagining of the desired behavior in a given situation, and the
actual behavior of the program code in that situation. [This would not be true
only in the case of deep conceptual misunderstandings, where the program may
actually perform as originally intended, but the programmer realizes that the
original intention does not solve the problem.]
For the programmer, the problem of translating intent into program code
corresponds to what Norman calls the Gulf of Execution. Interactive
tools such as on-line context-sensitive help systems and syntax-directed
editors can provide intelligent assistance in bridging that gap by relieving
reliance on the programmer's memory of programming language details.
Once program code is written, the problem remains of verifying that the code
written actually expresses the programmer's intent under all circumstances of
interest. This is the Gulf of Evaluation. Interactive tools such as
debuggers and program visualization systems can be invaluable in bridging that
gap. Instead of trying to imagine how the events in a program unfold over time,
why not have the machine show them to you?
We have designed a program debugging environment to explicitly support the
problem solving methodology of matching the expectations of a programmer
concerning the behavior of code to the actual behavior of the code. This
environment is called ZStep 94, a descendent of the stepper described in
[8].
Two principal activities in debugging that can be assisted by tools in the
programming environment are instrumentation and localization.
Instrumentation is the process of finding out what the behavior of a given
piece of code is, the software analog of attaching oscilloscope probes to a
hardware component. Traditional tools that assist instrumentation are trace,
breakpoints, and manually inserted print statements: trace instruments all
calls to a function, a breakpoint or print statement instruments a specific
function call. The problem with using trace and breakpoints in debugging is
that they require some plausible hypothesis as to where the bug might
be, so you know where to place the instrumentation. They are not of much help
when you have no idea where a bug might be, or there are too many possibilities
to check individually.
Localization is the process of isolating which piece of code is "responsible"
for some given undesirable behavior of a buggy program, without any prior
knowledge of where it might be. Among traditional tools, a stepper is
potentially the most effective localization tool, since it interactively
imitates the action of the interpreter, and the program can in theory be
stepped until the error is found.
However, traditional steppers have a fatal interface flaw: they have poor
control over the level of detail shown. Since the programmer's time is too
valuable to make looking at every step of an evaluation feasible, only those
details potentially relevant to locating the bug should be examined. Typical
steppers stop before evaluation of each expression and let the user choose
whether or not to see the internal details of the evaluation of the current
expression. But how can the user make the decision about whether to see the
details of an expression if he or she doesn't know whether this expression
contributes to the bug or not? This leaves the user in the same dilemma as the
instrumentation tools -- they must have a reasonable hypothesis about where the
bug might be before they can effectively use the debugging tools!
The solution adopted by ZStep 94 is to provide a reversible control structure.
It keeps a complete, incrementally generated history of the execution of the
program and its output. The user can confidently choose to temporarily ignore
the details of a particular expression, secure in the knowledge that if the
expression later proves to be relevant, the stepper can be backed up to look at
the details. Thus, ZStep 94 provides a true localization tool.
There has been a considerable amount of past work on reversible program
execution [1,3,8,9,11,15], but this work has concentrated on the details of
minimizing the space requirements of the history and tracking side effects to
data structures, both of which are important, but secondary to the user
interface aspects which are the emphasis of this paper. It is important not
only to "back up" variables to their previous values, but also to "back up" a
consistent view of the user interface, including static code, dynamic data, and
graphical output so that the user "backs up" their mental image of the program
execution.
The reversible control structure aspects of ZStep 94 are discussed in more
detail in [9]. We will address the issue of the computational expense of the
history-keeping mechanism later.
ZStep 94's main menu uses a bi-directional "video recorder" metaphor. The
single-arrow "play" and "reverse" correspond to single-step in a traditional
stepper, and the "fast-forward" and "rewind" operation go from an expression to
its value and vice versa, without displaying details.
FIGURE 3.
ZStep 94's "control menu"
It is important to note that ZStep 94's expression-by-expression stepping is
not the same as statement-by-statement or line-by-line stepping found in
many steppers for procedural languages. Individual lines or statements may
still contain complex computations, and it is a severe limitation on the
debugger if the granularity cannot be brought down finer than a statement or
line.
The two "graphic step" operations G> and G< are an innovation that lets
the user step the graphic output of the program back and forth, rather
than control the stepper in terms of the expressions of the code. This will be
discussed below.
ZStep 94 also has a "cruise control" mode, in which the stepper can run
continuously, in either direction, without user intervention. The distance of
the cursor from the center of the panel controls the speed. The user can stop
it at any point when an interesting event appears, and run the stepper in
either direction at that point.
A crucial problem in designing an interface for program debugging is
maintaining the visual context. Because programming is an activity in
which many items of interest have complex temporal and spatial relationships to
other items, it is important to present each item with its context clearly
identified.
Items such as the expression currently being evaluated, the value of a
variable, or graphics drawn by the code may have almost no meaning outside
their proper context. The programmer wants to know where in the code
that expression was evaluated, which instance of the code was it,
when did the variable have that value, how did that graphic
appear on the screen?
If the item and its visual context are spatially or temporally separated, a new
cognitive task is created for the user -- matching up the item with its
context. This new cognitive task creates an obstacle for debugging and puts
additional burden on the user's short term memory. Linear steppers or tracers
that simply print out the next expression to be evaluated create the task of
matching up the expression printed to the place in the code where that
expression appears. "Follow the bouncing ball" interfaces that point to an
expression and print out a value in another window lead to "ping-ponging" the
user's attention between the code display and the value display.
Because most programmers input their code as text in a text editor, the primary
mental image of the program becomes the text editor's display of the code.
Thus, to preserve the WYSIWYG property, ZStep 94 always use the text editor's
display to present code during debugging. To maintain visual continuity, it is
important that the exact form of the user's input be preserved, including
comments and formatting details, even if they are not semantically significant.
As the interpreter's focus moves, the source code of the expression that is
about to be evaluated, or has just returned a value, is highlighted.
Steppers always have the problem of how to show code expressions and their
values simultaneously. In ZStep 94, as the editor's focus moves from expression
to expression, we use a floating window to display the value. The display of
the value is always exactly aligned with the expression to which it
corresponds, so that the visual association between an expression and its value
is apparent. The floating value window is colored light green to indicate if
the expression is about to be evaluated, light blue to indicate a return value,
or yellow if it has caused an error.
Earlier versions had used the idea of substituting the value for the
code in place. This keeps the user's attention focused on the point of
execution, but loses the original expression. Another version maintained two
windows, one with the original code, the other with the substituted values, but
this was affected by the "ping-pong" problem. All these are valid approaches,
but we prefer the floating value window as the best compromise between
visibility and maintaining visual continuity. We might also explore making
the values window translucent, to reduce the effect of obscuring the
code underneath.
Our approach is to integrate instrumentation tools directly into the stepper.
We provide two facilities for pointing at a piece of code and inquiring about
the behavior of the code. Rather than inserting breakpoints or print statements
into the actual code and resubmitting the code to the interpreter or compiler,
we let the user simply point at the desired expression, then run the stepper
until that expression is reached. This is called Step to Mouse Position.
This is like a breakpoint, but an advantage is that the stepper is runnable
both forward and backward from the point where the program stops, and all
information about the computation remains available.
Even more dynamic is Show Value Under Mouse, which is like a
continuously updated Step to Mouse Position. The user simply waves the mouse
around the code, without clicking, and the expression currently underneath the
cursor displays its value window. Unlike Step to Mouse Position, this works
only for values that have been previously computed and are quickly retrievable,
and does not run the stepper past the current execution point.
We also provide a facility to track the behavior of a given expression over
different execution histories. The operation Current Form History
allows the user to point at an expression and bring up a menu of the past
values of that expression.
Another history facility is the Values Filter, which brings up a menu of
all returned values up to that point satisfying a condition. Clicking on one of
the values returns the stepper to the corresponding event. We could also
provide a filter on the expression executed, which would correspond to a
traditional trace.
One of the most essential, but also most difficult, tasks in debugging is being
able to reason backward from the manifestation of some buggy behavior to the
underlying cause. This is especially problematic when the program in question
itself has a graphical user interface. The programmer must work backwards from
an incorrect user interface display to the code responsible. Traditional tools
do not make any special provision for debugging programs with graphic output;
worse, the user interface of the debugger often interferes with the user
interface of the target program itself, making it impossible to debug!
ZStep 94 maintains a correspondence between events in the execution history and
graphical output produced by the current expression. Considerable care is taken
to assure that the graphic output always appears consistent with the state of
execution. When the stepper is run forward or backward to a certain point in
the execution, the graphic display is also moved to that point.
Furthermore, individual graphical objects on the display also are associated
with the events that gave rise to them. We allow the user to click on a
graphical object, such as a tree node in our example, and the stepper is
automatically positioned at the event which drew that node. Just as in our
other operations like Step to Mouse Position, the stepper is active at that
point, and the program can be run forward and backward from that point.
In reasoning from the behavior of the program to the code, it is useful to be
able to step the behavior rather than step the code. The user
conceptualizes the behavior of the program as a set of graphic states that
unfold over time, as the frames of an animation. The increments of execution
should be measured in terms of the animation frames rather than execution of
code, since events that happen in the code may or may not give rise to graphic
output.
ZStep 94 provides two operations, Graphic Step Forward and Graphic Step
Backward, that run the stepper forward or backward, respectively, until the
next event happens that results in significant graphic output. Below, each
graphic step results in an exploration of the next branch of the tree.
FIGURE 13. Four successive "graphic steps"
Each graphic step runs the stepper forward or backward until it is pointing at
the event which was responsible for the graphic output, and the stepper remains
live at all times. While stepping non-graphic code, the effects of previous
graphic operations remain visible, just as they do in a normally-running program.
We could also provide graphic step operations analogous to "graphic fast
forward" and "graphic rewind". Because the stepper can be run from either the
code or the graphics at any point in time, the user can easily move back and
forth between the different points of view.
ZStep 94 has a unique approach to dealing with execution errors. Traditionally,
errors during program execution are disruptive. They either print an error
message and halt execution, or put the user into a breakpoint loop, from which
special commands can examine the error, and the stack can be inspected. In
either case, errors disrupt execution and often lose information about partial
computations which may have finished correctly.
In ZStep 94, an expression which results in an error simply displays the error
message in place of the value of the subexpression most relevant to the error.
The value window is colored yellow to indicate the error condition. The stepper
remains active, all intermediate values are preserved, and the program can be
run backward to examine the history that led up to the error.
The current version of ZStep 94 has no independent display of the stack, though
the user can flip through events representing containing computations manually,
whether or not an error has occurred. Previous ZStep versions had a stack
display that was updated continuously with each event, animated in tandem with
the source code animation. Each stack frame was itself a menu item, and
clicking it would return you to that frame.
What happens once an error is found? ZStep 94 facilitates the repair phase,
since it leaves you in the text editor with the cursor pointing to exactly the
code in need of repair. Further, you are then just one click away from
restarting the entire computation after the edit. However, we cannot support
restarting the computation from any point in ZStep's history after the edit,
because editing a running program cannot guarantee consistency of the event
data structures. However, we could imagine techniques that would allow
conservative restart of the code, or at least warn you of potential
difficulties.
Abstract
Keywords:
Introduction
Debugging accounts for about half of the estimated $100/line cost of a
programmer's time [13], a major expense in the $92 billion US software market
[6], While the interface community has directed much attention toward improving
interfaces for end users of applications, surprisingly little attention has
gone toward improving the human interface of program debugging tools. Applying
widely recognized human-computer interface principles to the problem can result
in dramatic improvements in the effectiveness of debugging interfaces.
SUPPORTING THE COGNITIVE TASKS IN PROGRAMMING
PROBLEM SOLVING PROCESSES IN DEBUGGING: LOCALIZATION AND
INSTRUMENTATION
HINDSIGHT: REVERSIBLE CONTROL STRUCTURE
 FIGURE 4. ZStep 94's "cruise control"
KEEPING THE DEBUGGING PROBLEM IN CONTEXT
FOLLOW THE BOUNCING WINDOW
 FIGURE 5.
The value window moves through the code
FIGURE 5.
The value window moves through the code
WHAT DID THAT CODE DO?
WHAT HAS THAT CODE DONE?
 FIGURE 7 The history of values of an expression
WHAT CODE DID THAT?
 FIGURE 8.
 FIGURE 9.
Clicking on a graphical object backs up the stepper to the event which drew it
LET'S SEE THAT AGAIN, SLOWLY
 FIGURE 10.
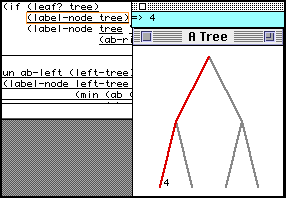 FIGURE 11.
 FIGURE 12.

ERROR CONDITIONS
 FIGURE 14. ZStep 94 displays an error message

