



Judith S. Olson, Gary M. Olson
Collaboratory for Research on Electronic Work (CREW)
The University of Michigan
701 Tappan Street
Ann Arbor, MI 48109-1234
(313) 747-4948 olsons@crew.umich.edu
David K. Meader
Department of Management Information Systems
Karl Eller Graduate School of Management
430 McClelland Hall
University of Arizona
Tucson, AZ 85721
(602) 621-3600 dmeader@bpa.arizona.edu
This paper grows out of a line of research whose aim is to understand these issues. We have focused on synchronous interactions among small teams working on design problems. We chose small teams because they are such a widespread and enduring form for working on projects in organizations, and are a hallmark of such new organizational forms as adhocracies [1,28]. We chose the task of design because it is a representative ill-structured problem solving task [22,25] that interleaves many subprocesses such as planning, creativity, decision-making and cognitive conflict (dimensions in McGrath's [12] task taxonomy). Design is also usually a collaborative task [e.g., 11].
In this line of research, we began with field studies of groups in real organizations doing software system design [17]. Our goal was to understand better what small group behavior was like for design tasks, and what opportunities existed for supporting this activity with technology. We learned much about both, leading to our developing a simple shared editor called ShrEdit [13] that we felt had properties that would be useful for groups doing these kinds of tasks. It provided the members of a group with an electronic workspace in which they could all enter and edit their ideas. We took ShrEdit into the laboratory to assess this. We created a design task that elicited design behavior similar to what we had seen in the field [19], and compared real groups of three people (i.e., people who knew each other and had worked together before they came into the laboratory) using ShrEdit with groups working with the more traditional meeting room media of whiteboard, and paper and pencil. The groups using ShrEdit produced higher quality designs, though they were somewhat less satisfied with their work. To our surprise, they produced higher quality designs by exploring fewer ideas rather than more.
The next step in this research, reported in this paper, was to study comparable groups working with ShrEdit but no longer physically co-located. In designing ShrEdit we assumed that groups would have other communication channels available to them. In a face-to-face setting, of course, the groups can talk and gesture in their usual interactive ways, and indeed, the groups in our studies engaged in extensive discussion while using ShrEdit as a workspace to capture and revise their emerging ideas. So in looking at the use of ShrEdit by distributed groups we provided them with other communication channels for talking and interacting.
We decided to provide communication for our groups that was as ideal as we could make it given their distributed set- up. We wanted a baseline for later studies that looked at other kinds of communication, such as digital desktop video. In the present study we focused on how groups of three performed when they have a shared workspace tool and ideal remote communication.
Many investigators have pointed out that shared workspace tools are important sources of coordination in collaborative problem solving tasks [4,7,27,30]. We know from our prior work [19] that ShrEdit is an effective shared workspace tool for the kind of design task we have used.
High quality audio is also very important to remote synchronous work [6,20,27]. So we had half our groups work with high quality audio in addition to the shared workspace. Our audio was full duplex, directional for both input and output, and of far better quality than found in teleconferencing or most commercial video conferencing systems.
More controversial is whether video adds significant value for groups doing distributed problem solving. While the research record is quite mixed [5,27], many theories [e.g., 3,23,24,29] and most people's intuitions are that video should add substantial value to such work. Thus, the other half of our groups had our good quality audio plus high quality analog video connections to each of their colleagues. The video was arranged in an optimal fashion to create the feeling of sitting around a table with one's colleagues, with the shared workspace in the center. We took more care than usual to create what we felt would be the best possible video conferencing set-up.
We were interested in how these video/audio groups using ShrEdit would compare to face-to-face groups using ShrEdit from our earlier study [19] on a range of measures: quality of the work product, satisfaction, and characteristics of the group process. We also compared these audio/video groups to the audio-only groups to assess the added effect of the video. What distinguishes our study from previous investigations is the use of an established workspace tool of known value for sharing the work, and the care we took to ensure that the audio and video were of the highest quality we could get with present communication technology.
Another function of this study was to establish a baseline from which we could conduct later studies of a variety of less-than-optimal communication technologies. Multimedia desktop conferencing systems that run over the Internet or ISDN lines are generally quite constrained in the quality of the audio and video they can provide. With our baseline data we can assess these situations in future investigations.
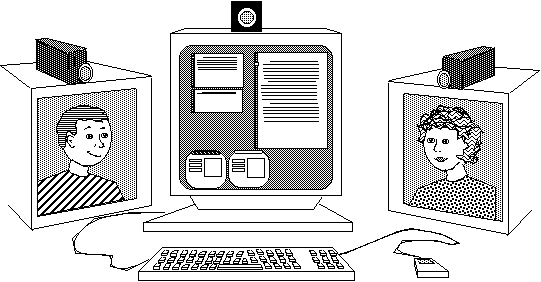
Figure 1. A diagram of the audio and video configuration in our remotely connected offices.
The microphones and speakers were similarly situated to either side of the central screen, corresponding to the person shown on the video screen. They were open full-duplex channels that additionally projected a sense of spatial location. Indeed, in the audio-only condition, group participants moved their heads to face the speaker boxes of the people they were addressing. The audio condition used the identical microphones and speakers of the video condition; the only difference was that the video monitors were turned off.
In this study, all groups were instructed to draft the initial requirements for an Automatic Post Office (APO), a collection of postal services offered through a stand-alone device similar to an ATM for which a prototype could be built by their fictitious company of 30 people in a year. They were instructed to determine the core services they would offer, some of the required equipment, the rough cost/benefit analysis, and a list of things they would like to investigate before the next time they would (hypothetically) meet. They were given 1-1/2 hours to complete the assignment, producing meeting notes that could be read by a (fictitious) additional group member who could not attend that day's meeting.
In total, we ran 39 groups, 37 of which survived the full 3 hours without a fire alarm going off (an unrelated event to the conduct of the experiment). One group was eliminated because they spent nearly half their time digressing. Thirty six groups were included in the final analysis. Eighteen of the groups used the full video and audio technologies to communicate; 18 had only the audio. All groups used ShrEdit.
We used the same quality measure as was used in our earlier study [19]. This measure was developed after extensive discussion with both designers and researchers of design. Three major aspects of the groups' output were scored: how completely the output covered all the aspects of the assigned task, the ease of understanding of the ideas reported in the document, and the judged quality of the post office design, including the feasibility of producing a prototype of the suggested post office within the stated time and manpower constraints, the coherence of the ideas, and the judged success of the ideas if marketed. Each aspect was then detailed further and a rating form constructed. Six researchers then coded the output from the same six meetings. The average pairwise correlation between raters was .85. Since this was well above acceptable range for reliability of measures, one researcher then coded the quality of the remaining meetings' outputs using the same instrument. Out of a possible score of 80 points, the quality of the meetings ranged from 40-74.
a) rate their satisfaction with the process that they used
(adapted from [9,10]) as well as with the design result
[10],
b) assess the evenness of the participants' contributions
[9] and c) identify a leader if one emerged.
c) rate how easy it was to understand the other
participants and be understood.
The first two sets of questions were identical to those asked of the groups run in the companion face-to-face study; the remaining 23, which focused on various details of the communication media, were new to this study.
Several new categories were required to account for the work surrounding producing the output: times when they would plan the organization and wording or dictate the words, called Plan and Write. In the supported groups, we required yet another two categories: times when they were confused about something having to do with the technology, and other comments about the placing their work into the windows on the screen. We called these Technology Confusion and Technology Management, respectively.
Inter-rater reliability of the core 22 categories were measured in two ways. A strict measure shows the correspondence of categorization, second by second; our inter-rater reliability is .68%, with a Cohen's K = .64. If we look at the summary measures used, the correlation between the two raters' summary statistics on time in category was .97.
   FTF         Remote     Remote            FTF
   Unsup.     Audio      Video        Supported

   54.7     =  56.7      =      61.5         =    64.4

                      |--------------p<.01----------------|
     |------------------------p<.01-----------------------|
     |------------(p<.09)------------|
Although these quality differences were not significant, they showed a pattern of differences with the face-to-face conditions that are interesting. All four quality ratings were not significantly different from their adjacent values (FTF Unsupported = Remote Audio; Remote Video = FTF with ShrEdit). However, FTF with ShrEdit was significantly higher than the Remote Audio (t(35) = 2.67, p < .01) and FTF Unsupported (t(36) = 2.71, p < .01). Remote Audio was not significantly higher than FTF Unsupported (p < .09).
In sum, if there are quality differences when one takes away video connections, they are small and do not always overcome the large between-group variances in performance. But more interesting, the quality of the output of work with remote high-quality video is not significantly different from that of face-to-face work. Remote work without video is not as good as face-to-face.
   Remote    Remote   FTF              FTF
   Audio      Video    Supported.   Un-Supported

   3.99           4.20    =      4.36               4.68

     |----p<.01-----|	     |-------p<.01----|
     |-------p<.01--------------------|
     |---------p<.01--------------------------------------|
		|---------------p<.01-------------|
Figure 3. Mean Ratings of the Perceived Quality of the Discussion for groups in four conditions, with indications of which pairs of conditions were significantly different from each other.
In other questions, the remote group with audio only reported being less able to tell how their other group members were reacting to things said (t(106) = 2.28, p < .025). They also reported that the communication system got in the way of their being able to persuade others about their ideas (t(106) = 3.52, p < .001) or to resolve disagreements (t(106) = 2.15, p < .03).
We asked the groups to spend an hour and a half working on the APO problem. Overall, the mean time spent in the meetings was 87 minutes, which was not significantly different over the four conditions.
Furthermore, the groups talked a great deal during this 87 minutes; they were not just silently typing. On average the groups spent 64 minutes talking. The three groups that had ShrEdit talked significantly less than the group using whiteboard paper and pencil, by 13 minutes (F(3,70) = 6.06, p < .001). There was no difference among the groups supported by ShrEdit, whether they be FTF or remote, or supported by video or only audio.
As described above, we coded the transcripts of the spoken
parts of the meetings, noting the kinds of activities they
engaged in, and then summarized how much total time was
spent in each activity as well as the flow between activities.
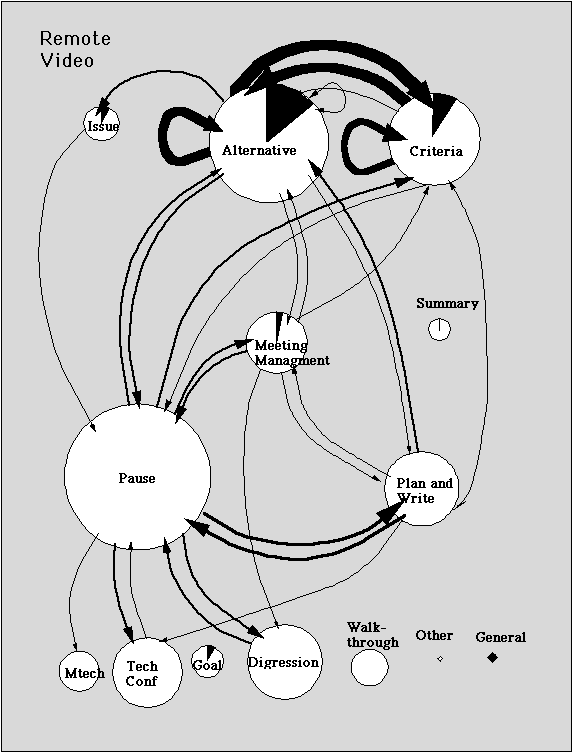
Figure 4 shows a view of the flow of activities, the face-to-
face supported groups on the left, the audio only ones in the
middle, and the video groups on the right. In these
diagrams, each category of activity is represented by a
circle, the area of which represents the total time the group
spent in that activity, aggregated over the whole meeting.
White portions of the circle represent the direct introduction
of the idea; the black wedges represent the time spent
clarifying that topic. The arrows denote the transitions
between them, the width of which reflects the likelihood of
going from one category to the next. Footnote 3
The groups in both conditions spent their time in almost
identical ways. Furthermore, they are almost identical to
the way in which face-to-face groups worked with the same
shared editor tool these groups used. The differences that
were significantly different included:
Video groups spent less time than audio groups
stating and clarifying the Issues (t(34) = 2.54, p < .02; t(34) = 2.25 p < .03).
Remote groups (both Video and Audio) spent
significantly more time managing their meeting
than the FTF group using ShrEdit (Video: t(35) =
2.92, p < .006; Audio: t(35) = 3.18, p < .003).
Remote groups (certainly Audio and marginally Video)
spent significantly more time clarifying what they
meant to each other (all categories combined) than the
FTF group using ShrEdit (Video: t(35) = 1.81, p < .08;
Audio: t(35) = 2.31, p < .003).
The perceptions of the users, however, is that video adds
value. The groups working at a distance without video do
not like it as much as those that have the video. They were
less able to tell how their other group members were
reacting to things said. They also reported that the
communication system got in the way of their being able
to persuade others about their ideas or to resolve
disagreements. Tang and Isaacs [27] found that groups in a
field setting who were offered video in addition to shared
workspace and audio used the system more heavily than
those who had audio and workspace tools, suggesting that
the satisfaction differences we saw in our study are probably
a harbinger of usage pattern differences if these capabilities
were discretionary.
However, judged by how people used their time, distributed
work does require greater process overhead. The remote
groups spent more time managing their work and clarifying
what they meant than the face-to-face groups. Working
under distributed circumstances is not equivalent to
working face-to-face. Perhaps there is more sense of what
others are doing and what they mean when we are face-to-
face than can be presented via even very good video
channels.
Figure 4 . Composite diagram showing the use of time for various activities along with the
pattern of transitions between
the activities for the
groups that had Video (right) Audio (middle) and those Face to Face. Enlarged versions the panel for each
of these three groups follows.
Enlarged view of Video (right) panel.
Enlarged view of Audio (middle) panel
Enlarged view of Face to Face (left) panel
These results are important. We confirm the results of
others [2, 14, 26] in that remote work can be done
without loss of quality. This study has added to this body
of findings, however, in that it uses intact groups doing a
more realistic task, and uses measures of process as well
as quality and satisfaction. In addition, we found that
remote work takes extra effort to manage the group and
clarify things. Adding video to remote work has some
value in terms of the work accomplished by the groups,
and has a clearer effect on the satisfaction of the group
members. People like to see each other. Video makes
them feel more able to communicate with each other, to
persuade and resolve issues. For work that extends over
long periods of time, these preferences are very likely to
be important, as shown in the Tang and Isaacs [27] field
study.
Acknowledgments
This work has been supported by the National Science
Foundation (Grant No. IRI-8902930), and by grants from
Ameritech, the Ameritech Foundation, and AT&T.;
Many people participated in the collection and analysis of
the data reported here, including Mark Carter, Stacey
Donahue, Sue Schuon, Barb Gamm, Patsy Gore, Arona
Pearson, Sidney Levy, Shawn Salata, Michael Walker,
Rodney Walker, David Sisson, and Isabelle Byrnes.
1. Bennis, W.G. (1968) The temporary society. In The
Temporary Society, W.G. Bennis & P.E. Slater (Eds.),
Harper & Row, New York.
5. Egido, C. (1990) Teleconferencing as a technology to
support cooperative work: Its possibilities and
limitations. In J. Galegher, R.E. Kraut, & C. Egido
(Eds.), Intellectual teamwork: Social and technological
foundations of cooperative work. Lawrence Erlbaum
Associates, Hillsdale, NJ. 351-371.
6. Fish, R.S., Kraut, R.E., & Chalfonte, B.L. (1990)
The VideoWindow system in informal communication.
In Proceedings of CSCW '90. ACM, New York.
7. Fish, R.S., Kraut, R.E., Root, R.W., & Rice, R.
(1993) Video as a technology for informal
communication. Communications of the ACM, 36,
48-61.
8. Gallupe, R., DeSanctis, G., and Dickson, G. (1988)
Computer-based support for group problem solving:
An experimental investigation. MISQ, 12, 277-296.
9. Gouran, D. S., Brown, C., and Henry, D. R. (1978)
Behavioral correlates of perceptions of quality in
decision-making discussions. Communication
Monographs. 45(1), March, 51-63.
10. Green, S. G., and Taber, T. D. (1980) The effects of
three social decision schemes on decision group process.
Organizational Behavior and Human Performance. 25,
97-106.
11. Herbsleb, J.D., Klein, H., Olson, G.M., Brunner, H.,
Olson, J.S., & Harding, J. (in press) Object-oriented
analysis and design in software project teams. Human-
Computer Interaction.
12. McGrath, J. E. (1984) Groups: Interaction and
performance. Englewood Cliffs, NJ: Prentice-Hall.
13 McGuffin, L., and Olson, G. M. (1992) ShrEdit: A
shared electronic workspace. CSMIL Technical Report
#45, The University of Michigan.
14. Minneman, S., and Bly, S. (1991) Managing a
trois: A study of a multi-user drawing tool in
distributed design work. Proceedings of the Conference
on Computer Human Interaction, ACM Press, 217-
224.
15. Moran, T. and Carroll, J., (Eds.) (in preparation)
Design Rationale.
16. Olson, G. M., Olson, J. S., Killey, L., Mack, L. A.,
Cornell, P., and Luchetti, R. (in press) Flexible
facilities for electronic meetings. In S. Kinney, R.
Bostrom, and R. Watson, (Eds) Computer Augmented
Teamwork: A Guided Tour. Van Nostrand Reinhold.
17. Olson, G. M., Olson, J. S., Carter, M., and
Storr�sten, M. (1992) Small group design meetings:
An analysis of collaboration. Human Computer
Interaction, 7, 347-374.
18. Olson, G. M., Olson, J. S., Storr�sten, M, Carter,
M., Herbsleb, J., and Rueter, H. (in press) The
structure of activity during design meetings. In T.
Moran and J. Carroll (Eds.) Design Rationale.
19. Olson, J.S., Olson, G.M., Storr�sten, M., & Carter,
M. (1993) Groupwork close up: A comparison of the
group design process with and without a simple group
editor. ACM Transactions on Information Systems,
11, 321-348.
20. Pagani, D.S., & Mackay, W.E. (1993) Bringing
media spaces into the real world. In G. De Michelis, C.
Simone, & K. Schmidt (Eds.), Proceedings of ECSCW
'93. Milan, Kluwer Academic, 341-356.
21. Putnam, L. L. (1983) Small group work climates: A
lag-sequential analysis of group interaction. Small
Group Behavior, 14(4), 465-494.
22. Reitman, W. R. (1965) Cognition and Thought New
York: Wiley.
23. Rutter, D.R. (1984) Looking and Seeing: The Role
of Visual Communication. Wiley, New York.
24. Short, J.A., Williams, E., & Christie, B. (1976) The
Social Psychology of Telecommunications. Wiley,
New York.
25. Simon, H.A. (1981) The Sciences of the Artificial
(2nd. Ed.) MIT Press, Cambridge, MA.
26. Smith, R. G., O'Shea, T., O'Malley, Cl, Scanlon, E.,
and Taylor, J. (1989) Preliminary experiments with a
distributed multi-media problem solving environment.
Proceedings of the First European Conference on
Computer Supported Cooperative Work, 19-34
27. Tang, J.C., & Isaacs, E. (1993) Why do users like
video? Studies of multi-media supported collaboration.
Computer Supported Cooperative Work (CSCW), 1,
163-196.
28. Toffler, A. (1980) The Third Wave. Morrow, New
York.
29. Weick, K.E., & Meader, D.K. (1993) Sensemaking
and group support systems. In L. Jessup & J. Valacich
(Eds.), Group support systems: New Perspectives.
Macmillan, New York.
30. Whittaker, S., Geelhoed, E., & Robinson, E. (1993)
Shared workspaces: How do they work and when are
they useful? International Journal of Man-Machine
Studies.
<.p>
31. Zigurs, I., Poole, M. S., and DeSanctis, G. L. (1988)
A study of influence in computer-mediated group
decision making. MISQ, 12, 645-665.
1 Ninety percent of the MBAs at Michigan have significant
work experience before coming back to school. These are
professionals with practical group experience.
2 Eye contact was not perfect. Participants reported that the
other person appeared to be looking at their throat when they
looked into their eyes.
3 To make this diagram less "busy," we include here only those
transitions that occurred at least 1% of the time.<a href="#Fnote3>Return to text
CONCLUSIONS
With high quality communication (both audio and video)
and a shared workspace tool, distributed groups can produce
work that is indistinguishable in quality from face-to-face
groups using the same workspace tool. Taking away the
video from distributed groups leads to poorer quality designs
when compared to face-to-face groups. The audio-only
groups were marginally different from the video/audio
groups. Thus, high quality group intellectual work is
possible under distributed conditions, and video appears to
add some value.
References
2. Chapanis, A., and Ochsman, R. N. (1972) Studies in
interactive communication: I. The effects of four
communication modes on the behavior of teams during
cooperative problem-solving. Human Factors, 14:
487-509.
3. Daft, R.L., & Lengel, R.H. (1986) Organizational
information requirements, media richness and structural
design. Management Science, 32, 554-571.
4. Dourish, P, and Bellotti, V. (1992) Awareness and
coordination in shared workspaces. Proceedings of the
Conference on Computer Supported Cooperative Work.
FOOTNOTES