




Department of Psychology,
University of York,
York YO1 5DD, U.K.
Email: AM1@unix.york.ac.uk, LAW4@unix.york.ac.uk
Experiments in the early nineteen seventies found that
performance measures, such as time to complete some joint
task, were relatively insensitive to gross manipulations of
communications facilities. For example, Chapanis (1975)
was unable to detect any effect of being able to see one's
partner on simple information transfer tasks. Measures
derived from the detailed analysis of the process of
communication, on the other hand, have been found to be
sensitive to relatively subtle manipulations. Sellen (1992),
for example, measured overlap in turns at talk. Participants
in a discussion task demonstrated significantly more
overlapping speech when copresent in the same room than
when communicating over either of the two video
communication configurations provided.
This paper reports measures communication process in the
form of gaze focus and speech. These were obtained using
Action Recorder (Watts and Monk, in preparation). This tool
allows the computation of the proportion of time a
participant is engaging in some activity. Here two types of
activity were examined: looking at the video window and
speech behaviour.
Participants for the experiment were recruited as they visited
a science exhibition. Their ages ranged from 10 - 65 and they
had a wide variety of backgrounds. In the large image
condition there was a 103mm tall x 140 mm wide image of
the other participant at the top left of the Apple 16" colour
monitor. There was no perceptible refresh problem as the
image was supplied as a video signal directly to a Raster Ops
24MXTV video grabbing board driving the computer
display. At the bottom right of the screen there was a
Hypercard stack with instructions for the joint tasks they
were to carry out. One participant was labelled "north" for
the purpose of these tasks and the other "south". Only north
was able to interact with the Hypercard stack but changes to
the display were relayed to south using the screen sharing
software Timbuktu Pro (Farallon). The instructions were to
reach agreement before north took any action with the stack.
The tasks consisted of filling in a short screen-based
questionnaire on their joint interests followed by a card game
in which south attempted to deceive north. The set up for
pairs in the small image condition was identical except that
the video image was 40 mm high and 65mm wide.
Two analysts went through each tape, one recording speech
activity and one recording gaze. This involved pressing pre-
defined keys to indicate the start time of each activity. Both
were unaware of the purpose of the experiment or the
experimental condition in which the recording was made.
The time stamped key presses obtained in this way were
transformed into state durations; these were then aggregated
using the SPSS statistical package to produce the statistics
described in the next section.
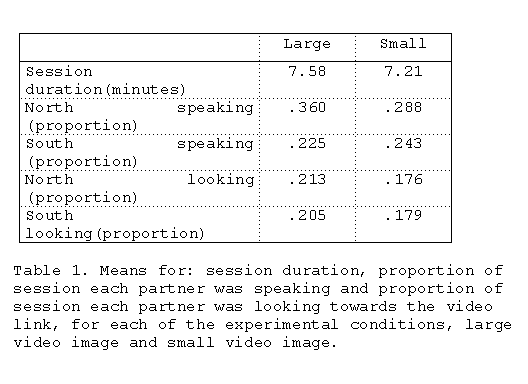
TABLE 1. Basic statistics about the behaviour
of the participants in this experiment.
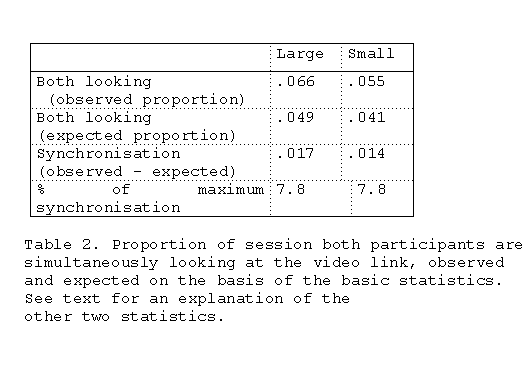
Table 2.Contingent statistics for gaze direction.
The proportion of time both north and south look
simultaneously, expected on the basis of chance, is given by
the product of the simple statistics for looking. When this is
computed, for each pair separately and then the expected
values averaged, we find that, though the observed value is
larger than the expected value for 14 of the 16 pairs, the
observed and chance expected values are very similar.
Naively, one might have expected that participants would
have been able to synchronise looks through the content of
their conversations, so that, they look at the video link at
the same time. This would have resulted in observed values
that were considerable larger than the expected values. Even
when the difference is expressed as a proportion of the
maximum value it could take (this is where the 'both-
looking' proportion is equal to the minimum of the two
'looking' proportions) the difference is small.
The overall conclusion that has to be drawn is that gaze
direction is not highly synchronised in the conversations of
these participants. Further, there are no significant
differences between the two video conditions in any of these
statistics.
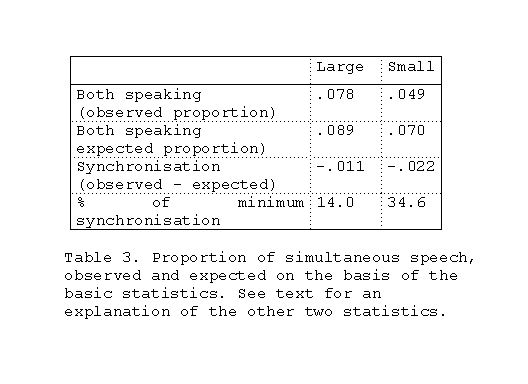
TABLE 3 presents a similar analysis of the proportion of
time spent in simultaneous speech. This time one would
expect that the observed proportion would be smaller than
the expected proportion as participants will want to
synchronise their speech to avoid interfering overlap. This is
indeed the case. When these differences are expressed as a
percentage of the minimum value possible (when there is
zero simultaneous speech) this synchronisation is sizeable,
especially in the case of the small video window
configuration.
Table 3.
Analysis of proportion of time spent in simultaneous speech.
The difference between the two conditions is significant
(t=2.67, p=.018). It would appear that pairs using the small
video window configuration synchronise their speech more
closely to avoid simultaneous speech. This is consistent
with Sellen's finding that copresent conversations contained
more overlapping speech than video mediated conversations.
Conversations with some simultaneous speech are more
fluent than conversations where there is none.
One could argue that the effect of the poor quality video link
has been to make the spoken conversation less fluent.
Whether this is a good or a bad thing depends on the criteria
one wishes to adopt. If one's aim is to provide an illusion of
copresence, with highly fluid highly interactive exchanges, it
may be bad and a large video link window may be preferred.
If one is more concerned with clarity of communication then
it is conceivable that the more synchronised speech is the
better, and a poor (or no) video link may be preferred.
Abstract
Thirty two members of the general public worked remotely
from one another in pairs on some simple joint tasks. All
the pairs had high quality audio links and were able to see
one another's faces through an on-screen video image. For
half the pairs this image was small (40 x 65 mm) and for the
other half it was large (103 x 140mm). The conversations
were analysed in terms of gaze focus (looking at the video
image or elsewhere) and speech (speaking or silent). It is
concluded that the small video image results in more formal
and less fluent verbal interaction but gaze behaviour is
unaltered
Keywords:
video communication, CSCW, analysis of
conversation.
THE EXPERIMENT
A variety of commercial computer systems now offer video
conferencing over a local area or wide area network.
Typically a camera is mounted over or under the computer
screen and an image of the remote person(s), with whom one
is communicating, is displayed in an on-screen window. The
quality of these video images is generally poor. Even with
modern network communication bandwidths and
compression algorithms it is only possible to transmit a
fraction of the information required for a fluid, high quality,
video image. For this reason the images displayed are
generally: (a) small in visual angle, (b) coarse grain in pixels
and (c) updated infrequently. There has been little systematic
study of the effect of this degradation of the image on the
quality of communication. This paper reports an experiment
looking at one of these factors, the size of the image.
ACTION RECORDER ANALYSIS
Action Recorder requires the analyst to define behaviour in
terms of activity sets. These must consist of mutually
exclusive activities. In this case there were four binary
activity sets:
During the experiment video tapes were made by tapping the
signals from the cameras used to provide the video link.
There was thus one tape for each participant in a pair. To
make it possible to relate the data on the two tapes the same
centisecond clock was mixed onto both at the time of
recording.
RESULTS
Basic statistics
Table 1
presents some basic statistics about the behaviour
of the participants in this experiment.
As one would expect with a task of this kind, that involves
reading shared resources, there was more silence than speech;
also the participants spent only about a fifth of their time
looking at the video link. This accords with other data
collected in this laboratory with different tasks and user
populations. The size of the video window has very little
effect on these basic statistics and none are significant. North
spends significantly more time speaking than south
(t(15)=3.42, p=.004). This is presumably due to the
dominant position north has, due to having control of the
Hypercard stack.
Contingent statistics
TABLE 2. presents some contingent statistics for gaze
direction. The SPSS aggregate command was used to
compute the proportion of time the pair was in the state:
North looking toward video link AND South looking toward
video link. With both large and small video windows, only a
small proportion of the session is spent with the pairs in
this state.
ACKNOWLEDGMENT:
This work was supported by the UK
Joint Council Initiative in Cognitive Science and HCI . We
would like to thank Owen Daly-Jones, Jo Appleby &
Stephen Pollock for their help running and scoring the
experiment.
References
1. Chapanis, A. (1975) Interactive human communication,
Scientific American, 232(3), 36-42.
2. Sellen, A. J. (1992) Speech patterns in video-mediated
conversations. In Bauersfeld, P., Bennett, J. & Lynch, G.
(Eds.), CHI'92 conference proceedings, New York: ACM,
pp. 49-59.