




Jock D. Mackinlay, Ramana Rao and Stuart K. Card
Xerox Palo Alto Research Center
3333 Coyote Hill Rd; Palo Alto, CA 94304
{mackinlay, rao, card}@parc.xerox.com
The proposed national information infrastructure includes the dream that
people will have easy access to many large information databases across the
Internet. Such increased access to information is likely to be useful, but
the prospect of large amounts of information remotely linked together
around the globe poses new challenges for the design of user interfaces for
information access. Internet users have difficulty discovering information
sources, have trouble learning how to search them, have suffered from slow
network information access, and have generally complained of being ``lost in
cyberspace.''
Two major approaches for network information access have emerged: search
and browsing. Search is exemplified by the DIALOG system, which permits
over 400 databases at a single site to be searched with a uniform
command-line user interface [5]. Browsing is exemplified by
the Mosaic user interface and World-Wide Web protocol that permit the user
to click on hypertext links and jump from document to document across
multiple sites [2]. Although both systems have significantly
advanced the accessibility of networked information, they also have
limitations. DIALOG's query language is complex and difficult to learn.
It works very well for professional librarians, who can spend the time to
develop proficiency, but it can be a substantial barrier for casual users.
Also, the nature of its scrolling teletype-style output makes it difficult
to use the results of a previous search to formulate a new query. On the
other hand, Mosaic provides easy browsing of the Web but its sequential
access makes it difficult for users to orient themselves and see patterns
in larger parts of the information space. Mosaic users frequently complain
of having trouble knowing where to go and losing previously-visited nodes.
Recently, 3D interactive animation and ``focus-plus-context'' techniques
have been developed for information visualization of large information
structures [10]. However, the techniques have typically been
applied to single information sets loaded into local memory. Extending
them to work on information repositories across the Internet requires that
we address the problem of coupling a high-bandwidth, local, interactive
user interface with a slow-response, distant information repository (the
``Fast UI/Slow Repository'' problem). The user interface operates at the
level of tenths of a second, whereas search results typically return in
tens of seconds.
Remote access also gives rise to the more general possibility of
interacting with multiple information repositories simultaneously (the
``Fast UI/Slow Multiple Repository'' problem). Multiple access can
compensate the user for slow network access, but it poses additional
challenges for the design of information access user interfaces. In
particular, simultaneously accessing multiple repositories increases the
difficulty of access management, which is the task of choosing where
and when to search or browse.
In this paper, we address the more general Fast UI/Slow Multiple Repository
problem. We also address a related problem, the graceful integration of
search, browsing, and access management, which are all impacted by slow
network access. We describe a system, Butterfly, for simultaneously
exploring multiple DIALOG bibliographic databases across the Internet using
3D interactive animation techniques that we had previously developed for
various Fast UI/Fast Repository applications [10]. Our goals
are to allow richer, more rapid information assimilation than a
conventional turn-taking interface (e.g., Mosaic or DIALOG), to avoid user
overhead, to enable faster DIALOG investigations, to enable more complex
investigations, and to reduce training time.
The key technique used by Butterfly is to embed access activity organically
within an information visualization that supports the integrated management
of search and browsing. In particular, Butterfly creates a virtual
environment that grows under user control as asynchronous query processes
link bibliographic records to form citation graphs. Our positive
experience with the Butterfly implementation suggests that this approach
may be quite useful in general for network information access. We conclude
with a description of this approach, which we call Organic User
Interfaces for Information Access.
Although search and browsing have received more attention than access
management, the size and complexity of the Internet make access management
an important and challenging task that deserves more attention. In
particular, our studies show that people typically engage in a cyclic,
dynamic process to discover where they should look in a database for
information [11]. Network access makes this process more
difficult to manage. Each access may involve substantial
delays, either from communication overhead or the sheer size of the
databases to be searched. Moreover, networked databases sometimes charge
access fees that must be factored into access management decisions.
Finally, the assimilation of results from search and browsing are not
well supported, especially across different repositories.
Consider the standard method of interaction with DIALOG.
Figure 1 is an excerpt of a DIALOG search of the Science
Citation Index in which the user retrieves a bibliographic item and then
queries the database about articles that cite that item (called
citers). In addition to the query language developed for professional
librarians, this typescript illustrates two major challenges that DIALOG
interaction has for casual users: 1) the textual stream of results is
difficult to interpret, and 2) results are not easily incorporated into new
queries for related information. The DIALOG system partially mitigates
these problems by using labels such as S1 for search results. These
labels can be used to retrieve detailed information in a rich set of
formats designed to reduce access costs. They can also be used to
establish scopes for subsequent queries. However, these result labels are
not particularly mnemonic and are somewhat difficult to find in the
typescript. Even harder to find in the typescript is result information,
such as an article's title and authors, that is typically used to formulate
queries for related information. Furthermore, this information must be
re-entered by the user. Local librarians have even been observed using a
pencil to write down DIALOG output that is to be used as subsequent input.
Abstract
This paper describes Butterfly, an Information Visualizer application for
accessing DIALOG's Science Citation databases across the Internet. Network
information often involves slow access that conflicts with the use of
highly-interactive information visualization. Butterfly addresses this
problem, integrating search, browsing, and access management via four
techniques: 1) visualization supports the assimilation of retrieved
information and integrates search and browsing activity, 2)
automatically-created ``link-generating'' queries assemble bibliographic
records that contain reference information into citation graphs, 3)
asynchronous query processes explore the resulting graphs for the user, and
4) process controllers allow the user to manage these processes. We use
our positive experience with the Butterfly implementation to propose a
general information access approach, called Organic User Interfaces
for Information Access, in which a virtual landscape grows under user
control as information is accessed automatically.
Keywords:
information visualization, search, browsing, access
management, information retrieval, organic user interfaces, data fusion,
hypertext, citation graphs
Introduction
CHALLENGES OF NETWORK INFORMATION ACCESS
              ANNOTATIONS   TYPESCRIPT
            select source | ?b 434
                          | <16 lines of accounting information removed>
         search on author | ?s au=card sk
                          |
  search S1 had 7 results |      S1       7  AU=CARD SK
type S1 format 3 result 1 | ?t 1/3/1
                          |
                          |  1/3/1
                          | DIALOG(R)File 434:Scisearch(R)
                          | (C) 1994 Inst For Sci Info. All Rts. Reserv.
                          |
                          | 12204937   Genuine Article#: KU797   No. Reference...
                          | Title: INFORMATION VISUALIZATION USING 3D INTERAC...
             first author | Author(S): ROBERTSON GG; CARD SK; MACKINLAY JD
                          | Corporate Source: XEROX CORP,PALO ALTO RES CTR,33...
                          |     ALTO//CA/94304
          year, vol, page | Journal: COMMUNICATIONS OF THE ACM, 1993, V36, N4...
                          | ISSN: 0001-0782
                          | Language: ENGLISH   Document Type: ARTICLE
        search for citers | ?s cr=robertson gg, 1993, v36, p56, ?
                          |
   search S2 had 1 result |       S2       1  CR=ROBERTSON GG, 1993, V36, P56, ?
Figure 1: This annotated typescript from a
DIALOG
session shows a search of the Science Citation Database for articles that
include S. K. Card as an author. Typescripts like this do not
particularly show the structure of a search.
A recent advance over traditional search-oriented information access applications such as DIALOG are graphical user interfaces for information visualization [1,6,10]. Such interfaces make access management easier because queries become user interface actions that occur immediately and are revisable. The user can rapidly explore alternative queries. The graphical display makes these explorations memorable. However, real-time visualization involves a tight coupling of the user interface to the information, which is expensive to achieve for networked databases. Users either need to invest in high-bandwidth network connections or enough disk storage so that they can retrieve the entire database locally for high-bandwidth access during visualization.
Browsing-oriented applications, such as Mosaic, can easily deal with the size and complexity of the network because they access information incrementally. The hypertext research community has developed a variety of techniques to help users manage such access activity [3,4,12]. These techniques include bookmarks so that the user can easily return to an interesting place, maps of the network surrounding the current node, and visual cues describing the browsing history. However, even with these techniques, browsing large databases can be laborious and complex, particularly when the network adds communication delays to every access. Ideally, the computer should shoulder some of the burden of processing the large collections while the user retains the responsibility of managing the access activity. One of the goals of the research described in this paper was to retain the naturalness of the browsing approach while incorporating the power of queries for processing databases.
Butterfly is an Information Visualizer (IV) application for accessing three DIALOG databases, the Science Citation Index, the Social-Science Citation Index, and the IEEE Inspec database [5,10]. These databases describe a large number of scholarly articles. For example, the 1977 Science Citation database contained approximately five hundred thousand articles that were the source of seven million reference links to three million articles [7].
Butterfly is based on four key ideas:
1. Visualizations Of References And Citers: We started with the idea to visualize scholarly articles as user interface objects with two wings, one wing for listing an article's references and the other wing for listing the article's citers. We called these objects ``butterflies'' for the obvious reason. Our goal was to use 3D interactive animation to support rapid browsing among butterflies by treating the wings as links from one butterfly object to related butterflies. We also designed various visual cues described below for the butterfly wings to help the user identify interesting areas to explore and otherwise manage their access.
2. Link-Generating Queries: DIALOG is a search-oriented application for accessing database records and does not provide much support for links among database records. The Science Citations Index databases, in particular, are collections of bibliographic records that describe references with strings of the form: first author, year, volume, page number, and an abbreviation of the book or journal title. We use this reference information to automatically create ``link-generating'' queries that link an article's record to the corresponding records for the article's references and citers.
3. Asynchronous Query Processes: Given link-generating queries, users can use the Butterfly visualization to browse the citation graphs implicit in the Science Citations Index databases by clicking on the butterfly wings. However, the size of the citation database makes such browsing laborious. In particular, looking at articles listed on the wings of a butterfly is a repetitive process of manual navigation. Furthermore, a four second delay is inherent in the execution of every DIALOG command.
We address this problem with an idea as old as multi-processing window systems: Butterfly uses asynchronous query processes to access the databases. We have identified a number of advantages for using asynchronous processing for information access [9], including that the user does not have to wait for queries to complete. The interesting innovation in the Butterfly design is that it automatically creates query processes for the user to avoid explicit user management overhead. This innovation requires a policy for creating such processes because the branching factor of the citation graph would rapidly exhaust all machine resources if all branches were expanded simultaneously. Furthermore, indiscriminate expansion would be expensive given that DIALOG charges access fees. Thus, Butterfly uses a conservative policy: query process are only created automatically for the butterfly that is in the user's current focus of attention. The resulting behavior is very intuitive and lightweight. When the user pauses to view an interesting butterfly, asynchronous query processes are automatically created to gather additional information about that item. When the user moves on, these processes are automatically terminated.
4. Embedded Process Control: Sometimes, however, attention is not a sufficient heuristic for controlling query processes. For example, a user may just want to focus on the references of a survey article and stop processes from retrieving the citer information. Therefore, we represent the asynchronous query processes in the Butterfly visualization to give fine control. Thus, when the task requires it, the user can explicitly create and terminate query processes to direct them toward desirable information. This embedding is discussed in the next section.
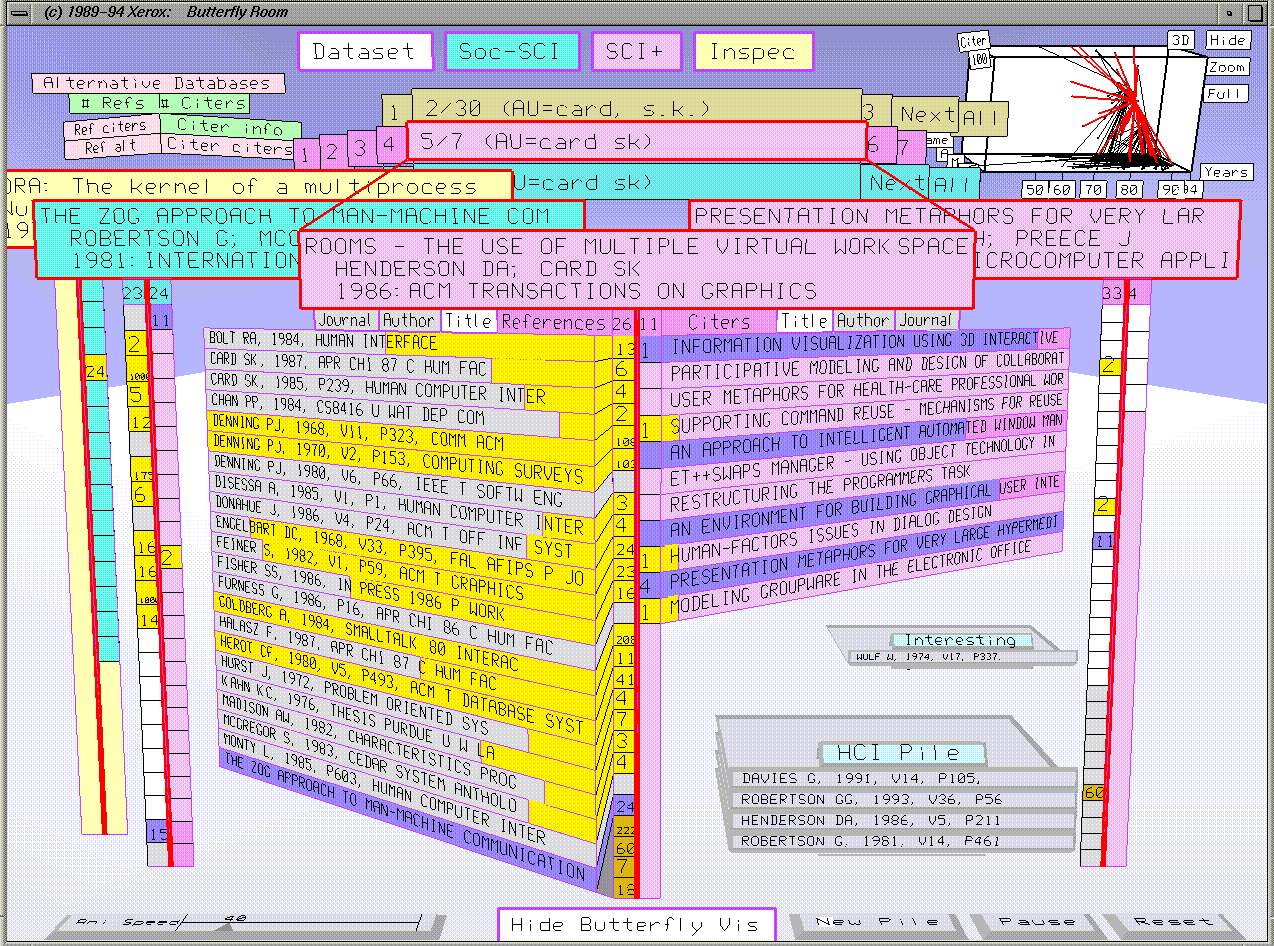
This section describes the components of the Butterfly visualization shown in the screen snapshot in Figure 2 and Mackinlay Color Plate 1. The design of the Butterfly visualization combines query and browsing elements. The upper part of the snapshot focuses on queries and the lower part focuses on browsing. Users typically start with queries to find articles in topic areas of interest and then browse reference and citation links to find related articles. The ordering of the following Butterfly user interface components indicates a rough flow of user activity:
 Full Size Image
Figure 2: A snapshot of the Butterfly visualizer. The upper
part focuses on search and the lower part focuses on browsing. We have
grouped the user interface objects to indicate a rough flow of user
activity. These groups are discussed in the text.
Mackinlay Color Plate 1
is a color version of this snapshot.
1. Sources. Three buttons at the top generate forms for entering queries to three DIALOG database sources: the Science Citation Index (SCI+), the Social-Science Citation Index (Soc-SCI), and an IEEE database (Inspec), which was included in this prototype because it includes computer science conference articles as well as the journal articles found in the other two databases. The colors of these three database buttons are used throughout the interface to indicate the source of information. The final button is used to read files in Refer format, a common bibliographic interchange standard.
2. Result Pyramids. A pyramid of objects with the top of the pyramid facing toward the user is used to visualize the results of database queries. The pyramid in the snapshot is partially covered by butterfly objects that have folded wings. A key issue for query visualization is that query results can have unpredictable size, which can make access management difficult because of the cost (both time and money) of retrieving large results. Butterfly addresses this problem by disclosing results progressively. Each query result is visualized as a horizontal layer in the pyramid colored to indicate the source database. The snapshot shows three queries each looking for articles authored by card sk in one of the three databases. The query result currently at the top of the pyramid is result 5 from the Science Citation database. This object is colored to indicate its source database. The colors of objects in the rest of the pyramid have been darkened to indicate that they are not the top object. New results are retrieved by clicking on the Next button. The All button is used to create an asynchronous query process that sequentially retrieves the items of a query result. The advantage of a pyramid shape is that it uses less screen space and reinforces the retrieval ordering of the results.
3. A Butterfly. The current query result is described with a butterfly, which is in the center of the snapshot. The head of the butterfly lists the title, author, year, and journal of the article. The rest of a butterfly consists of a neck, body, and two wings. The wings of the butterfly list the article's references on the left and the article's citers found in the Science Citation database on the right. The items listed on a wing are called veins. Since an article can have many references and citers, the wings are limited to 22 veins to ensure that the text is legible. The body segments show the total number of items, and fan lines connect the visible segments to the veins. The neck contains a variety of buttons for changing the views on the wings and two buttons for controlling the creation and termination of asynchronous query processes to retrieve information about the references and citers. A user can also click on a reference or citer vein to execute a link-generating query that creates a butterfly for the corresponding reference or citer. The relationship between such butterflies is shown by placing them next to each other as described in Group 4 below.
Color is used on the butterfly veins to provide the user with a rich collection of information for access management. Citations form complex graph structures that provide many paths for visiting an article. Sometimes the user will have already visited a citer or reference by some other path than the current article's butterfly. In this case, the vein color is darkened. References or citers visited directly from the current article's butterfly are shown with purple bars. The length of the bar indicates the order in which a given wing's articles have been visited, with the most-recently visited being longest. Yellow bars indicate the number of citers known to the system for each article. Articles with many citers are often a good place to browse. The goal here is to graphically encode information about about the unexplored parts of the citation graph so that the user can manage access effectively. The number of known citers is also printed in the corresponding segment on the body of the butterfly where it can be always be read, including when the wings are folded.
4. Linked Butterflies. To the left and right of the current butterfly are butterflies with folded wings that have been explored by the user by following link-generating queries from the current butterfly. Each article in this chain of butterflies references the article to the left and is cited by the article to the right.
5. Scatterplot. In the upper right corner of the snapshot is a 3D scatterplot of the retrieved information. The points represent articles plotted against time, the alphabetic sort of the last name of the first author of an article, and the number of known citers for an article. Edges show the citation relationships among articles. Buttons provide a variety of viewing controls. Unlike butterfly chains, which show a few articles close to the current butterfly, the scatterplot provides a complete view of the citation graph that has been explored by the user. The scatterplot clearly shows the complexity of citation graphs and provides a contextual view for the user's activity. The current article and its reference and citer links are shown in red.
6. Piles. The objects below the butterflies are piles of articles that the user has selected. Piles allow the user to remember specific articles and to group related articles. An article is put in a pile by clicking on the head of the current butterfly, which produces a text widget with the corresponding bibliographic information in Refer file format. This text widget can be placed in a pile or stored to disk, where the information can be exchanged with other bibliographic applications.
7. Process Controller. In the upper left corner is a stylized miniature of a butterfly for controlling the automatic creation of asynchronous query processes. Simple on/off switches control the automatic creation of different types of processes, such as whether an article is described in alternative databases, how many references or citers it has, and what the title, author, and journal are for its citers. A pale-green color indicates that the corresponding asynchronous query process may be started. A click turns the switch pale-red and terminates the corresponding process, which may be sequentially visiting the veins of a wing.
Computers and people often operate at different time constants. For example, user interface transitions can often occur instantaneously, which can require cognitive effort as the user assimilates what has changed. Previous research on Information Visualizer developed an animation loop architecture for buffering the user from such mismatches in time constants. We have found that animated transitions let the human perceptual system track user interface changes with much less cognitive effort. For example, new results are brought to the top of the query pyramid with an animation that lets the user track the change perceptually.
An innovative aspect of the Butterfly visualizer is its use of the animation loop to buffer the user from long-running asynchronous query processes. Fundamentally, the animation loop and the asynchronous query process combine to give the Butterfly visualization an organic feel. Mackinlay Color Plate 2 shows the automatic growth of a butterfly as query processes retrieve information about an article that has just been put at the top of the query result pyramid. Pale green is used in the interface to indicate where query processes are active. Initially, nothing is known about the article except that it exists, which automatically starts a query process to retrieve its database record. While this query process is running, the user sees the pale green butterfly head that is shown in the left panel of Plate 2 and is free to examine and/or manipulate any other part of the visualization. When the process completes, the retrieved database record contains enough information to grow the article's butterfly except for the right wing, which describes the article's citers. This partial butterfly is shown in the middle panel of Plate 2. It includes a pale green citer label to indicate that another query process has automatically started to query the database about the article's citers. The right panel in Plate 2 includes the right wing of the butterfly and two active query processes. A citer-wing process is retrieving bibliographic information for each citer and a reference-wing process is retrieving the number of citers (shown with yellow bars) for each reference.
The Butterfly visualizer uses the object-oriented architecture of the Information Visualizer [10]. For example, most components in Figure 2 have top-level objects that control the positions of child objects. An earlier paper describes the architecture we use for accessing multiple databases and handling query results [9]. The implementation of query processes uses well-known computer science techniques for multiprocess programming, including process locks, critical sections, and a transaction-style modification of user interface objects.
Animation mitigates the apparent complexity of the Butterfly, making it easier to learn. Animated transitions often require precise adjustment of multiple objects. For example, a click on the query pyramid causes that clicked object to grow and replace the topmost object, which must shrink and move away. We added a new animation control mechanism to the IV architecture to accomplish this adjustment. This mechanism uses timer objects, which monitor elapsed real-time to adjust a visual value through a range. In the Butterfly, we use timer objects that adjust through the range zero to one, which makes it easy to adjust an arbitrary set of object properties through arbitrary ranges. The timer's value represents the percentage of growth, and one minus the timer value is the percentage of shrinkage. Typically, we use a single timer object for an animated transition, which ensures all objects adjust in unison.
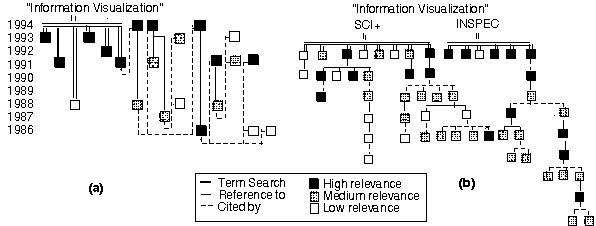
Butterfly has been successfully used for a number of complex searches of the Science Citation and Inspec databases. For example, Figure 3 describes a search for information visualization articles that resulted in over 40 relevant articles. This search, which was done by an alpha user who had no previous experience with the system, shows that Butterfly searches can have complex control structure and can proceed deeply into the search space.
 Full Size Image
Figure 3: Two protocol fragments of a complex search for
articles about information visualization. Diagram (a) shows that Butterfly
searches can have complex control structure. Branching lines indicate that
the
user returned to a previous search state to explore another part of the
database. Diagram (b) shows that Butterfly searches can proceed deeply into
the search space.
The Butterfly visualizer generates and parses DIALOG typescripts that would normally have to be processed directly by the user. Clearly, users cannot generate and absorb typescripts at the same rate without the support of Butterfly's visual interface or similar techniques (although expert DIALOG users might deploy additional advanced DIALOG commands not supported by Butterfly). Furthermore, our alpha users managed useful and fairly efficient searches with only modest training (< 30 minutes). In contrast, text-based access to DIALOG typically involves 6 hours of formal training, but explains more functionality than provided by Butterfly. A focus group of professional librarians (who were expert DIALOG users) generally thought the system would help them in their work.
Figure 3(a) shows the analysis of a protocol fragment from an alpha user creating a bibliography on the topic ``information visualization''. The diagram shows retrieved articles plotted by year, with user activity generally proceeding from left to right. Double lines show articles generated by a keyword request, dotted lines lead to articles found through reverse citation, and solid lines lead to articles found through references in a given article. The figure shows how the system made it possible to go forward and backward in time following chains of links forward and backward. In particular, the figure shows two cases of complex user control structure, where citing links led to reference links and then the user resumed from a previous state of the search.
Figure 3(b) suppresses time and plots a larger fragment of the protocol so as to show the depth and structure of citation chaining. The figure documents the use of chained combinations of forward and reverse citations up to 9 levels deep. By contrast, one of our professional librarians reported that most DIALOG users consider reference chains of length 3 to be extraordinarily deep [8]. The figure further shows many cases of falling back to previous parts of a chain and pursuing other linkages. This protocol clearly suggests that users are aided in doing complex searches by improving the speed of movement through the retrieved literary space, by allowing asynchronous query processes to carry out in parallel much of the overhead work of the searches, and by providing a manipulable visualization for the control structure.
The Butterfly application provides a high-bandwidth easy-to-learn user
interface for accessing multiple slow repositories by organically embedding
access activity, including search, browsing, and access management, within
an information visualization that allows richer, more rapid information
assimilation than Dialog's typescript interface. Automatically formulated
link-generating queries reduce the number of queries that must be
formulated by the user, and asynchronous query processes, including
automatic creation, reduce the overhead associated with accessing networked
databases.
The Butterfly application was developed as part of the Information
Visualizer (IV) project [10]. Although its major contribution
to the project was exploring the use of visualization techniques for
accessing multiple slow network repositories, it also continued our
exploration of interactive animation and 3D graphics. Interactive
animation, in particular, improves the understandability of the Butterfly
design. 3D increases the density of the workspace, with the placement of
tools, such as the piles and scatterplot, in the distance where they can be
seen without taking up much scarce screen space. However, the folded
butterfly wings and pyramid of results are mostly compensating for 3D fonts
that must be larger than corresponding 2D fonts. It should be possible to
develop 2D versions of these components.
Our positive experience with the Butterfly implementation suggests this
approach might be generally effective for building applications for
accessing networked information. We believe these ``Organic User
Interfaces for Information Access'' will include four components, which
generalize the four key ideas underlying the Butterfly application:
1. Information Landscapes:
As butterflies fly through the
forest, they help to construct information landscapes, which are
virtual environments that hold retrieved information. These ``workspaces''
will be familiar places that persist over time as users organize retrieved
information using tools like Butterfly's piles and scatterplot.
Visualization techniques, such as animation and graphical presentation, will
support rapid movement across these landscapes, which will include
graphical indicators, similar to the yellow bars on the butterfly wings,
that will indicate promising areas to explore in the ``terra incognita'' of
information not yet retrieved.
2. Growth Sites:
Although databases typically store
information in discrete chunks, information rarely exists in isolation.
For example, the citation relationships that are automatically provided by
Butterfly's link-generating queries are not the only links possible among
scholarly articles. People often want to link bibliographic records by
their shared authors, journals, subject matter, etc. These links form
growth sites in the information landscape, where existing information can
be used to automatically construct queries for related information.
3. Growth Agents:
As in nature, information landscapes
will have a multitude of potential growth sites that can easily consume all
human and computational resources. The requirement for human resources can
be partially reduced with growth agents, asynchronous processes that
grow an information landscape. A key issue is how these agents are
deployed. Butterfly uses a conservative policy for automatic deployment,
which is to grow where the user attention is focused.
4. Growth Controllers:
Finally, information landscapes
will include mechanisms, such as the butterfly miniature, for managing
growth. The growth controllers will let users direct the activity of
growth agents, much like a gardener shapes a plant to maximize fruit production.
We believe the notion of an organic user interfaces for information access
will expand to include a multiplicity of information landscapes for
individuals, groups, and society. These landscapes will be used as
workspaces and channels of communication.
DISCUSSION
ORGANIC USER INTERFACES
Acknowledgments:
Access to the DIALOG Information Service was
part of a collaborative research agreement with Xerox PARC. George
Robertson developed the Pile implementation and the IV architecture. Mark
Stefix developed the Timer objects. Polle Zellweger suggested substantial
improvements to the paper.
 Full Size Image
Mackinlay, Color Plate 1:
This snapshot shows the Butterfly visualizer
application for searching citation links. Link-generating queries support
automatic creation of asynchronous query processes that grow a
visualization of the search space. Metaphorically, the Butterfly
visualization is like an information landscape that can be watched and
pruned by the user to grow the search in fruitful directions.


 Full Size: Panel A
Panel B
Panel C
Full Size: Panel A
Panel B
Panel C
Mackinlay, Color Plate 2:
These three panels shows how asynchronous query
processes automatically grow a butterfly. Query processes are shown in pale
green. The left panel shows a query process retrieving the database record
associated with the butterfly's article. The middle panel shows a query
process retrieving the citers for the article. The right panel shows two
query processes retrieving information about the references and citers.
Fri Feb 3 16:34:31 PST 1995

